Intro to Functions
Welcome to The Math Forge complete beginner’s guide to calculus—designed for you, the curious mind with little to none prior experience in calculus (or even advanced algebra). Whether you're a student, a lifelong learner, or someone who’s always felt math wasn’t for them, this course will walk you—step by step—into one of the most powerful ideas humans have ever created.
Calculus is the math of change and accumulation. It helps us understand how fast things move, how populations grow, how planets orbit, and even how your coffee cools over time. But don’t worry—before we touch a formula, we’ll build the intuitive foundation so it all makes sense.
Unit 1 Functions
Understanding Functions, Variables, and Graphs
Goal of This Unit:
By the end of this unit, you’ll be able to:
-
Understand what a variable is
-
Read and create simple functions
-
Interpret a graph of a function
-
Identify inputs, outputs, domain, and range
Why This Matters:
Before you learn calculus, you need to understand how math communicates. Math is a language—and if we want to talk about motion, change, and patterns, we first need the vocabulary.
What is a Variable?
In everyday life, we say things like:
"The more hours you study, the better your grade."
That means one thing depends on another.
In math, we write: y=f(x)
-
x is the input — the thing you control (hours studied)
-
y is the output — the result you get (your grade)
We call x and y variables because their values can change.
What Is a Function?
A function is a rule that tells us how to turn input into output.
Example: f(x)=2x+1
This means: Take a number (like 3)
Multiply it by 2 → 6
Add 1 → 7
So: f(3)=7
Think of it like a vending machine:
-
You put in a number (input)
-
The machine follows a rule
-
You get a result (output)
Graphing a Function
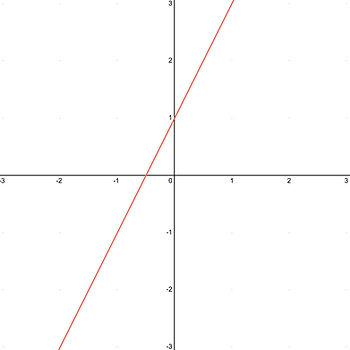
Let’s graph f(x)=2x+1
x f(x) = 2x + 1
-2 2(-2) + 1 = -3
-1 2(-1) + 1 = -1
0 2(0) + 1 = 1
1 2(1) + 1 = 3
2 2(2) + 1 = 5
The output is listed in the left column, while
the input appears in the right column.
You can think of a function as a machine:
you provide an input value (x), and the
function applies a specific rule to produce
an output value, denoted as f(x).
For example, in the function shown to the
right: If we input 1, the function first
multiplies it by 2 and then adds 1, resulting in:
f(x)=2(x)+1 -> 2(1)+1 -> 3
Thus, the output corresponding to the input of 1 is 3.
The best way to graph it is by choosing input values, calculating the corresponding output values, and then placing the resulting coordinates on a Cartesian plane. Once the points are plotted, connect them using a ruler to form a straight line.
What Is a Slope?
The slope of a line describes its steepness and direction.
It tells you how much the output (f(x)) changes when the input (x) increases by 1.
The slope is often referred to as "rise over run"—that is, how much the graph goes up or down for each step left or right. the slope is given by the number multiplying x. In this case the slope is 2.
What Is the Y-Intercept?
The y-intercept is the point where the graph crosses the y-axis.
It represents the value of f(x) when the input x = 0.
In this equation:
f(0)=2(0)+1=1
So, the y-intercept is at the point (0, 1).
Understanding f(x) = y
When we use f(x) in math, we’re talking about a function—a rule that takes an input (which we call x) and gives an output (which we often call y).
So when we say "f(x) equals y", it just means that when we put a number into the function, we get another number out.
For example, think of a vending machine:
You choose a number (x),
The machine gives you a snack (y).
So, f(x) is just another way to say "the output" or "y".